In the smart city concept, information and communication technology (ICT) is fully exploited to increase the efficiency of mobility, retail, and delivery services, to minimize energy consumption and air pollution, and to reduce the response time to casualties and hazard sites. The goals are often formulated in abstract terms such as liveability, economic progress, quality of life, sustainable development, or attractiveness. In the smart city concept, decisions are not made ad hoc or based on political beliefs or preoccupations. Instead, decision-making is informed, based on the plethora of data obtained from sensors and analyzed using smart algorithms – possibly based on machine-learning principles – running on high-performance computers. A city cannot be smart without the permanent availability of data collected by sensors mounted on static or moving objects.
Flood threats are increasing due to rising sea levels and rapid urbanization. Flooding is caused by an accumulation of water which may result from heavy rainfall, swollen rivers of dike breaches. Flooding causes degradation of assets, economic losses, injuries, and health risks. Renovation of dikes, creation of water overflow areas, and protection of vulnerable dunes are essential for urbanized lowlands such as the Mississippi River area and the Rhine/Meuse Delta. For these purposes, detailed and accurate knowledge is required on the variations in elevation of the river bed and the surrounding area, height of dikes, flood waves, the along-track and across-track slope of the river, and the water-resistance associated with land use. The use of a digital elevation model (DEM) or, even better, a 3D map derived from point clouds as input for flood models provides insight into areas at a high risk of inundation. The development of a new urbanized area will affect the flow of water. Is the sewerage system still able to drain off the water after heavy rainfall? Does the rainwater still flow in the direction of the river or reservoirs? Should the drainage layout be improved? These are all questions a smart city should be able to answer, and the solutions lie in the expert analysis of 3D geodata by geomatics professionals.
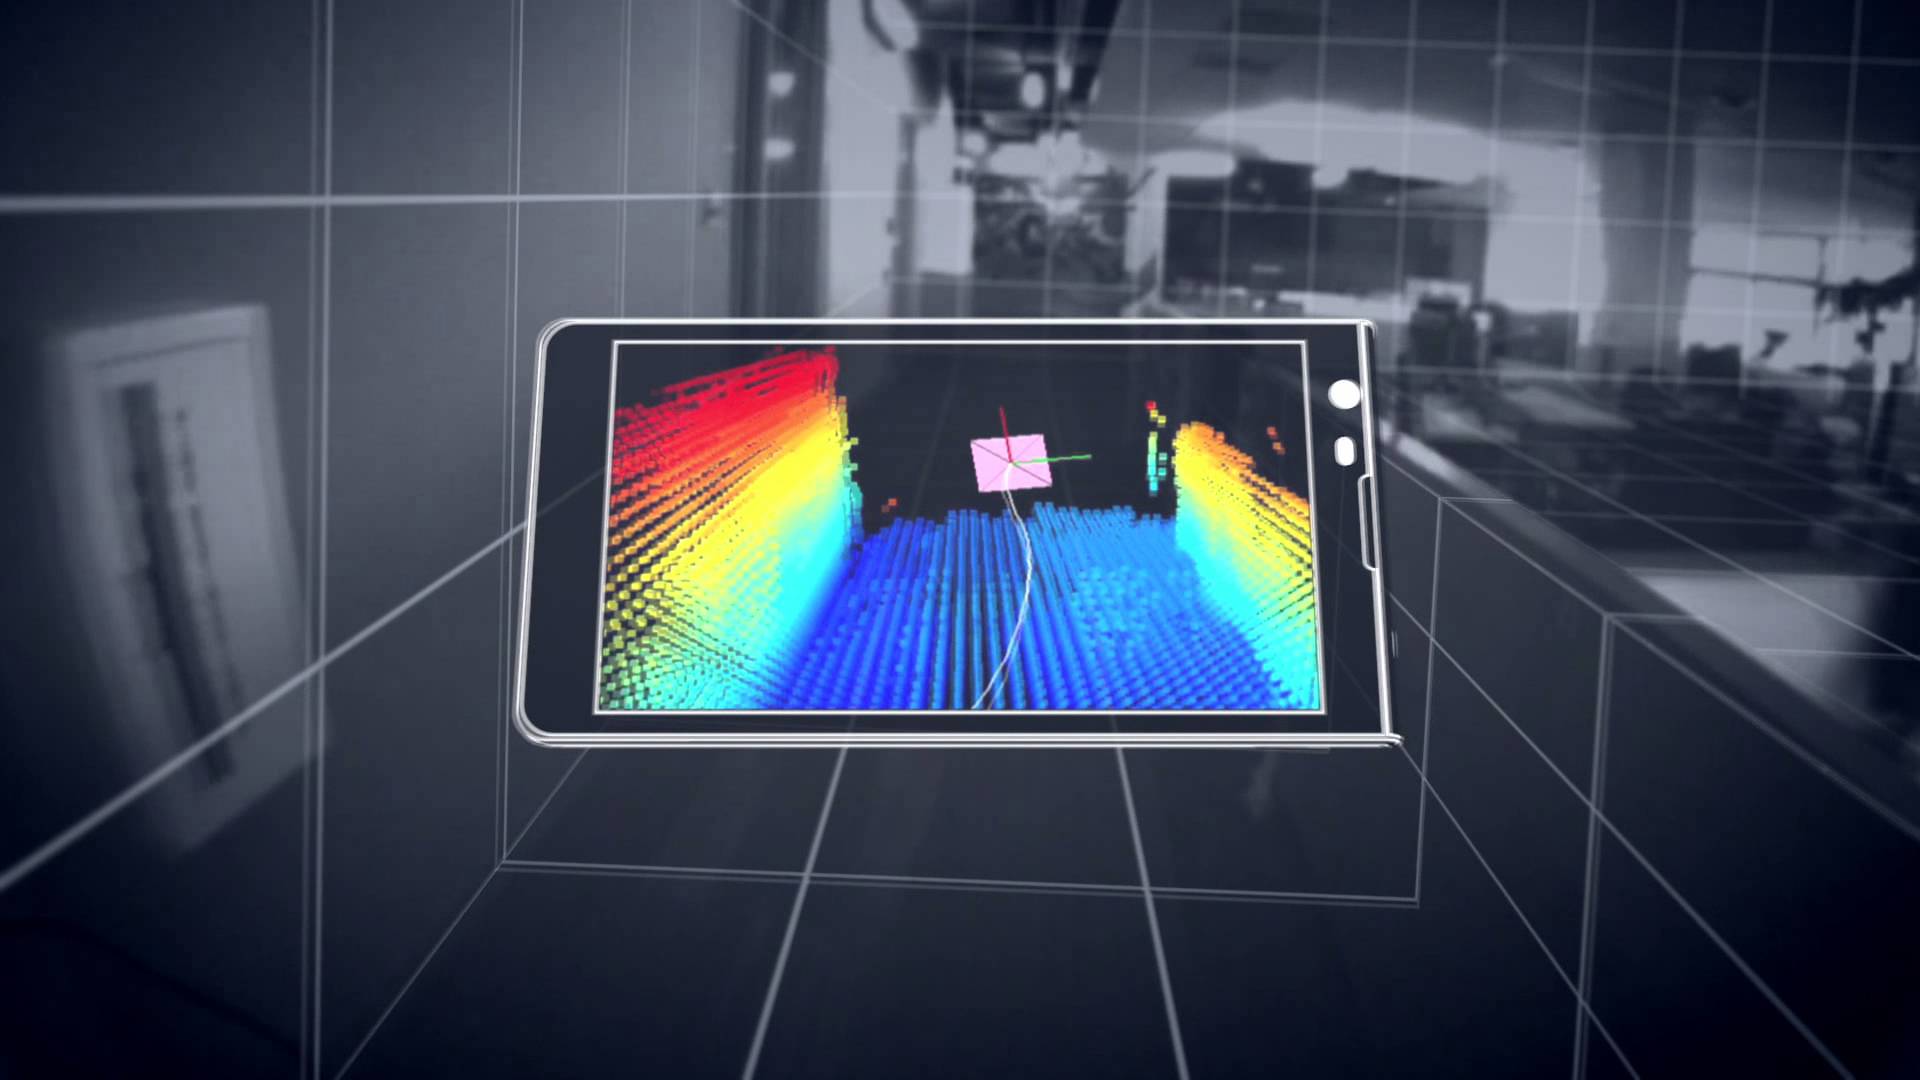
Essential in the smart city concept is the availability and continuous production of digital data, which may be collected dynamically or statically, continuously or intermittently. Smartphones and social media channels such as Twitter deliver real-time data on human movements and how people use the city’s space, either by public transport or their own methods and other facilities. Static sensors distributed over the city produce data on particulate matter, noise pollution, temperature, groundwater level and so on. Cameras can detect traffic accidents and enable rescue workers to assess injuries while still rushing to the scene of a disaster. The permanent stream of real-time data captured by a dense sensor network needs to be processed, analyzed, used in decision-making and disseminated to stakeholders. For this, the location of each sensor, whether static or dynamic (such as a smartphone in a cyclist’s pocket), must be known in a uniform coordinate system. To guarantee the smart use of all sensor data, the skeleton of a smart city consists of cadastral maps, master plans, utility maps (containing the location of underground pipelines, cables, sewerage systems, manholes and much more), as-built plans, maps outlining buildings and roads, and 3D maps at the necessary level of detail.
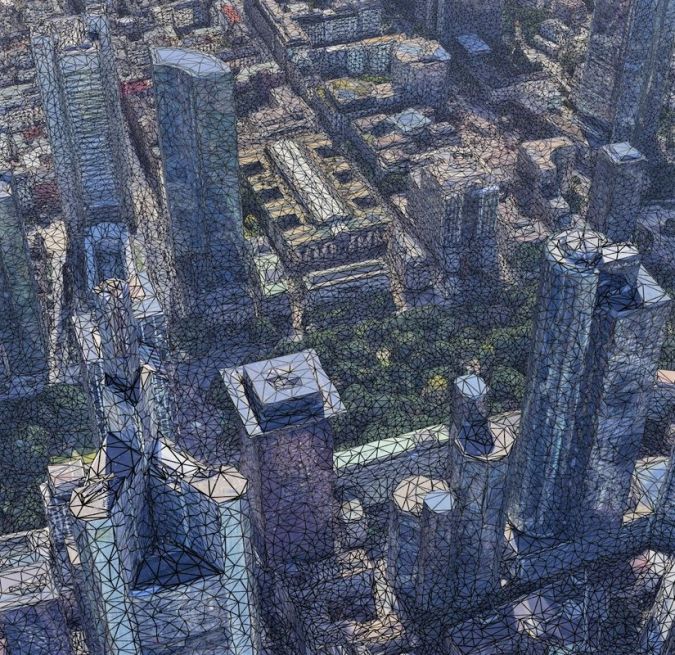
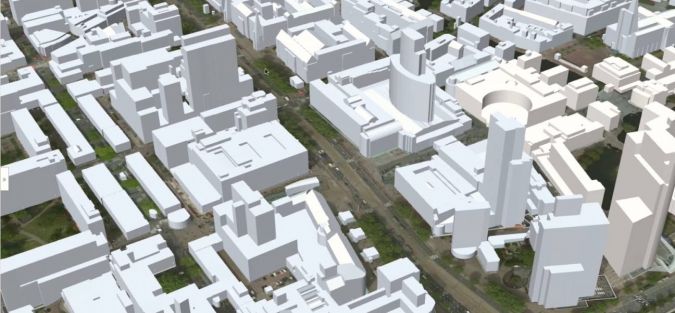
3D maps include the height dimension which is essential for many smart city applications such as flood risk monitoring, emergency response, viewpoint analysis and calculation of the solar energy potential of parcels and roofs. Making a city really smart starts with the creation of an accurate 3D map covering the entire city. Of course, such a 3D city map should be precise, detailed and up to date. Positional or thematic inaccuracies and outdatedness will impair proper decision-making. The very nature of geoinformation means that damage originating from substandard products may not be immediately recognizable. Mistakes made today may – a decade or two later – cause society significant losses, not only moneywise, but also in terms of injuries, accidents, demolished houses, and human suffering. Accurate 3D mapping is therefore an important, even essential, asset underpinning the smart city concept. Capturing and representing the 3D space of a city is challenging because of the level of detail required. 3D mapping requires the right data, the right software tools and geomatics professionals with the right knowledge.
Source: Point Clouds and Smart Cities