


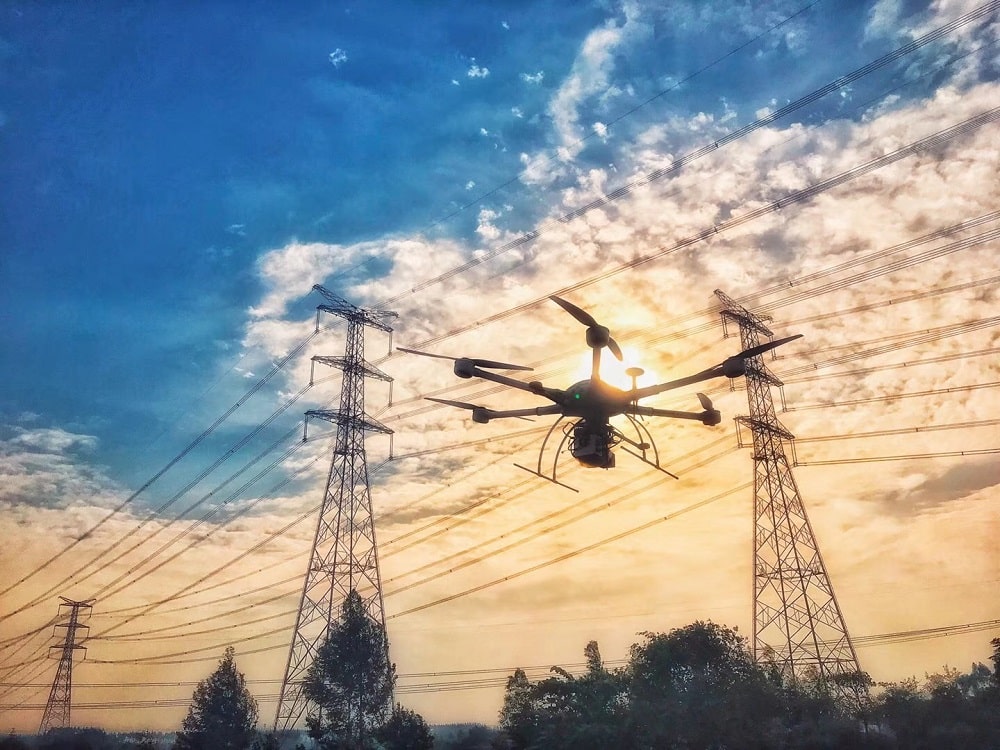
Routine inspection of power transmission lines is critical for securing the uninterrupted distribution of electricity. Recently, energy service providers have been turning to the sky in order to conduct their surveying and analysis. Largely automated UAV technology equipped with LiDAR hardware has emerged as an effective alternative method for inspecting energy corridors.
The Qingyuan Power Supply Bureau of Guangdong Province, China, utilized the GVI workflow to carry out a risk assessment/management survey of more than 2,500 kilometers of transmission lines. Surveying in this area typically takes place during spring, when potentially hazardous vegetation such as bamboo and eucalyptus species grow most rapidly. A total of six teams of surveyors were deployed over a two-month period to complete the airborne survey, three-times faster than ground-based methods. The hardware utilized included six GVI LiAir Standard 32e, a UAV-mounted LiDAR system. Conversion and acquisition software, LiAcquire, allows for real-time display and conversion for raw LiDAR and POS data.
Learn more about What is LiDAR? How does it work?
LiGeoreference, a proprietary georeferencing software for aerial LiDAR datasets, involves combining the data from the inertial navigation system (INS) and the GPS to provide the accurate position information of the aircraft and the oblique distance measured by the laser pulse.
Through proper georeferencing, positioning inaccuracies may be corrected
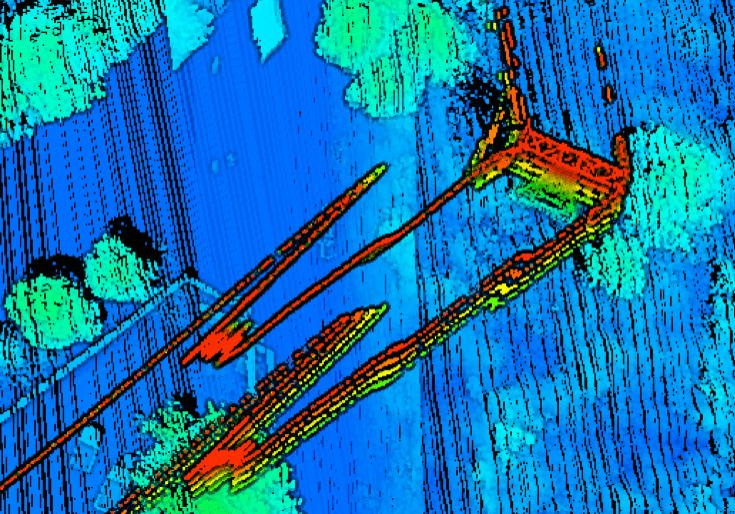
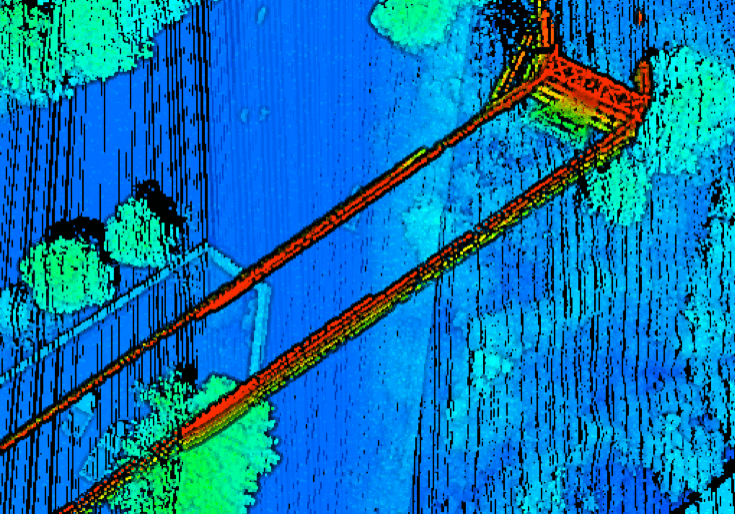
Sections of the transmission corridor were also above water – a difficult element to work with – both georeferencing and post-processing.
Optimization using LiGeoreference
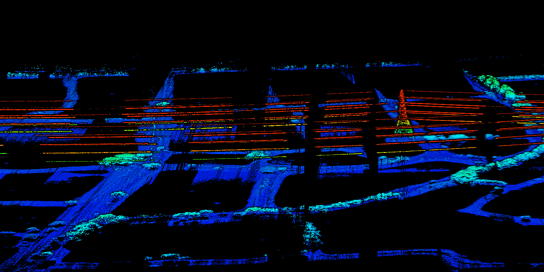
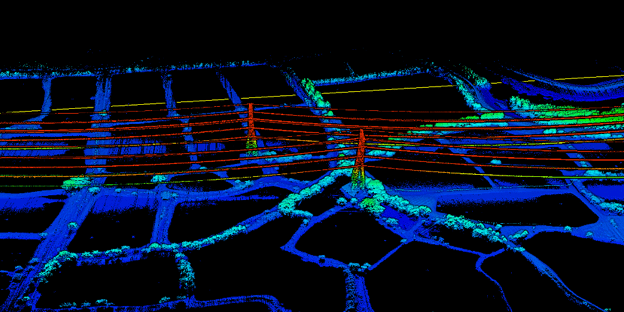
“After setting the flight path in the system, the drone-mounted system can automatically capture real-time information such as line position and vegetation and greatly improve the inspection quality, whilst maintaining the safety of personnel.” – Wang Linsheng, Director of Qingyuan Power Supply Bureau
Following the acquisition phase, the point cloud data was then imported into post-processing software, LiDAR360. The software contains modules for specific applications.
Learn more Lidar applications with LiDAR in Forestry: Finding DBH Values from Handheld Mobile LiDAR.
The Power Line module provides machine-learning algorithms for automatically classifying ground, transmission towers, power lines, buildings, and vegetation. It is possible to simulate the influence of environmental variabilities along the corridor. It can also detect a range of user-defined hazardous points, such as vegetation overgrowth and tree fall, after which will be included in a self-generated inspection report.
The workflow for generating the results requires the basic settings and detection parameter settings such as target coordinate system and voltage level settings. Functions are included for adding transmission towers sequentially.
After editing the transmission towers, the file can then be saved. The next step is to generate a training dataset for automatically classifying power lines, transmission towers, vegetation, and other objects.
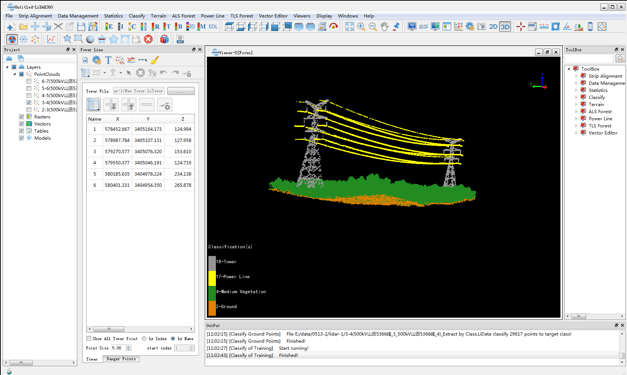
After generating training samples of ground points and vegetation points, users may generate the training file. Accuracy will continue to improve based on the richness of the training datasets.
The next step is to clip and classify point cloud data into tower, power line, ground points, noise and unclassified data according to the tower file and training samples.
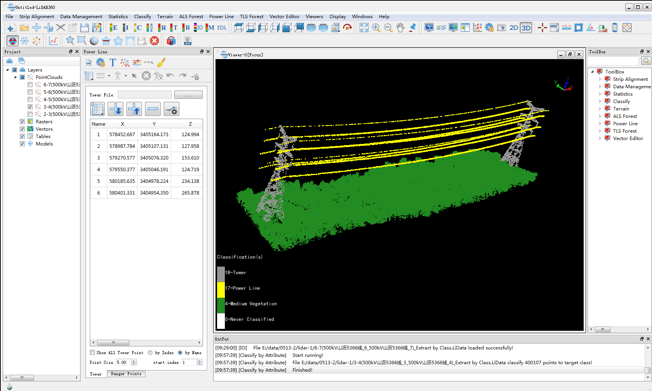
After processing, the Lidar data will be divided into several separate files, each of which represents the point cloud of a powerline segment. From here, users may further examine the results and manually correct the results if there are any errors.

The final step is to automatically detect hazardous points and generate a user report in order to review and assess both the current clearance violations and simulate the imminent risks.
Hazard Detection
Detecting clearance danger points according to the user-defined, ‘safe distance’ threshold. These include minimum distance, safe distance, cluster threshold and maximum cluster range.
Over the 2,500 kilometers corridor, this workflow was able to detect 40 hazardous points. The majority of hazardous points were due to overgrown vegetation or extreme transmission line sag. Future simulated conditions allowed Qingyuan Power Supply Bureau to recognize how both strong side winds and high temperatures were affecting functionality and ultimately decreasing transmission efficiency. The speed at which surveying and analysis can be completed was also a major issue.
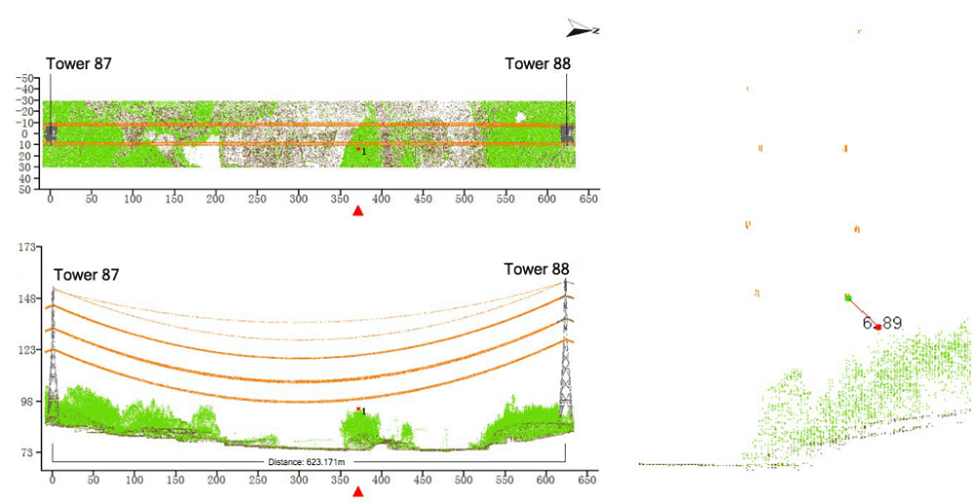
Methodologies to power line surveying and analysis tend to differ somewhat depending on the requirements set forth by a country or a company. For this reason, LiDAR360’s Power Line module is customizable according to user’s workflow and required outputs. Currently, the module has several user-defined versions allowing for a variety of predicted simulations, risk assessments and reported content.
For more information please visit Power Line Corridor Mapping.